DATA ANALYST PORTFOLIO
Project 5
Call Center Dashboard || Excel
🎯 Objective
This Excel-based dashboard offers a visual summary of call center performance, tracking key metrics such as call volume, duration, customer satisfaction, and revenue. It enables stakeholders to explore trends, compare agent performance, and gain insights into customer behavior through interactive charts and tables.
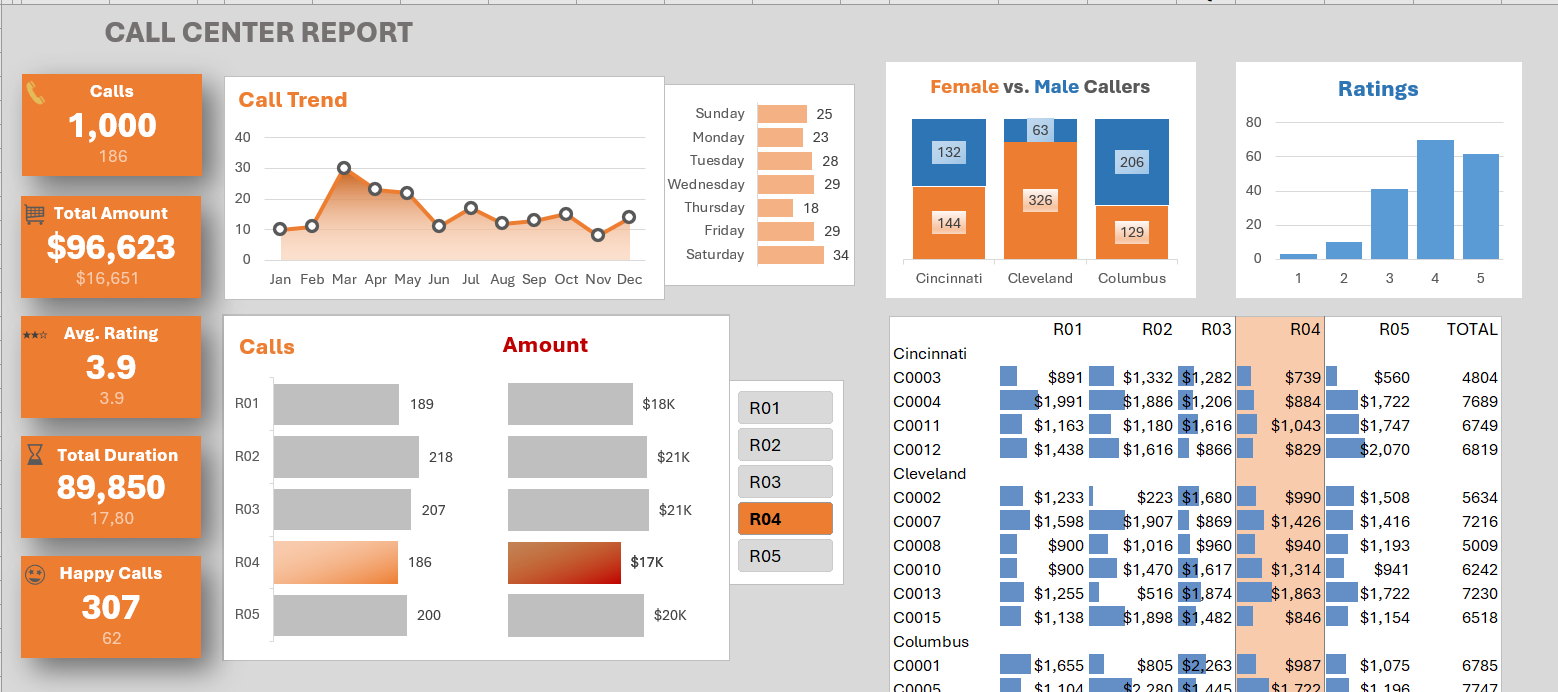
Excel-Based Call Center Dashboard Showcasing Key Metrics and Interactive Visuals.
🧠 Project Overview
- The objective of this project was to develop a centralized and interactive dashboard that provides clear visibility into the performance of a call center. It aims to help stakeholders monitor operational efficiency, track trends in call volume and duration, and evaluate individual agent performance. Additionally, the dashboard was designed to analyze caller demographics, measure customer satisfaction through ratings, and understand revenue contributions by customer segment. Overall, the goal was to turn raw call center data into actionable insights for improved decision-making.
- Tools Used: Microsoft Excel
- Techniques: Trend Analysis, Dynamic Charts, Categorical Analysis, KPI Tracking, Conditional Formatting, Customer Segmentation
🔧 What I Did
- Designed and structured the dashboard layout for clarity and accessibility.
- Created dynamic charts to allow for flexible, user-driven exploration.
- Applied conditional formatting to highlight key trends and variances.
- Ensured the dashboard was responsive to slicer inputs for better interactivity.
- Summarized performance metrics into an executive-friendly view.
📦 Key Deliverables
- Monthly Call Volume Trend Line.
- Weekday Call Distribution Bar Chart.
- Gender-based Caller Demographics (Stacked Column).
- Rating Distribution Histogram.
- Agent-wise Call and Revenue Metrics (Dynamic View)
- Customer-Level Revenue Table with Data Bars
- KPI Scorecards: Total Calls, Revenue, Ratings, Duration, Happy Calls
See Code here!