DATA ANALYST PORTFOLIO
Project-1
Crash Data Analysis – New Zealand Road Safety Insights || Python
🎯 Objective
To analyze historical crash data across New Zealand and uncover patterns related to crash severity, vehicle types, weather, and regional trends, helping to identify areas of concern for road safety.
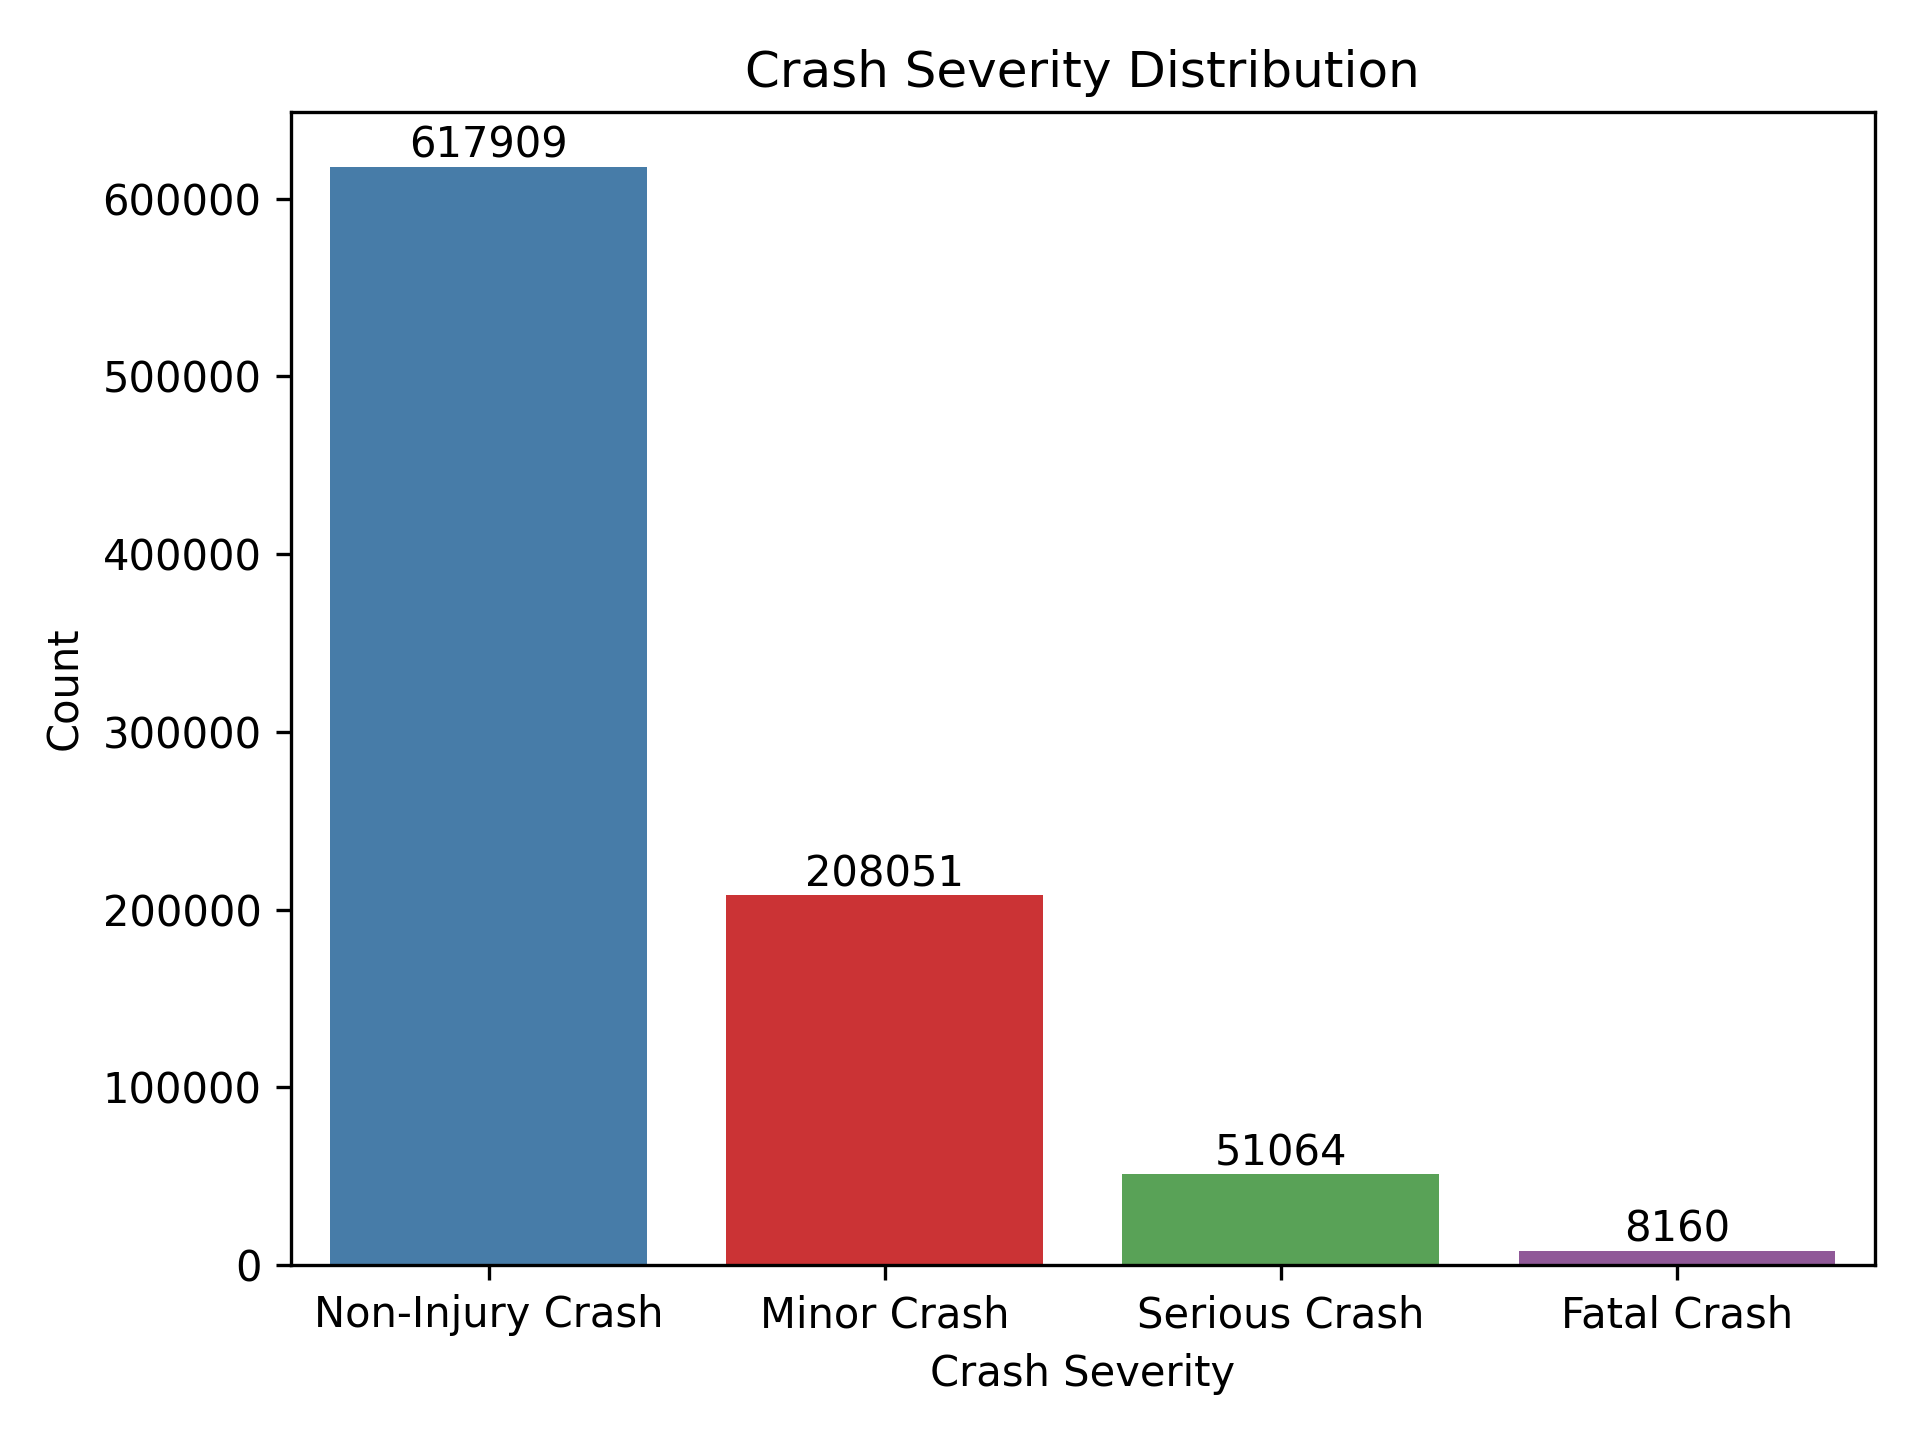
Crash Severity Countplot
🧠 Project Overview
This project explores over 880,000 crash records sourced from the NZTA Open Data Portal. By cleaning and visualizing this real-world dataset using Python, I aimed to derive meaningful insights about road safety in different conditions and regions. The analysis focuses on understanding how environmental and behavioral factors influence crash outcomes, and highlights areas that may benefit from deeper investigation or policy support.
🔧 What I Did
- Cleaned and reshaped raw crash data using Pandas for effective analysis.
- Handled missing values, filtered records, and simplified columns to focus on relevant crash metrics.
- Conducted exploratory visual analysis using Matplotlib and Seaborn.
- Analyzed crash severity by region, light and weather conditions, and vehicle involvement.
- Created clear visual narratives that highlight trends and risk factors.
- Documented insights, caveats, and limitations of the dataset transparently.
📦 Key Deliverables
- Exploratory Data Analysis (EDA) notebook with annotated visuals.
- Region-wise crash breakdowns and severity distributions.
- Insights on environmental factors (light, weather) affecting crash outcomes.
- Identification of high-risk vehicle types (motorcycles, bicycles).
- GitHub repository with full code and visual output.
See Code here! Read my Article!