DATA ANALYST PORTFOLIO
Project 2
Stock Market Analytics || SQL
💼 Overview
I worked on a project that involved writing SQL queries to extract insights from a financial database combining stock data, social media sentiment, influencer predictions, and user portfolios. The focus was on answering real business questions that could support reporting and investment decisions.
✅ What I Built
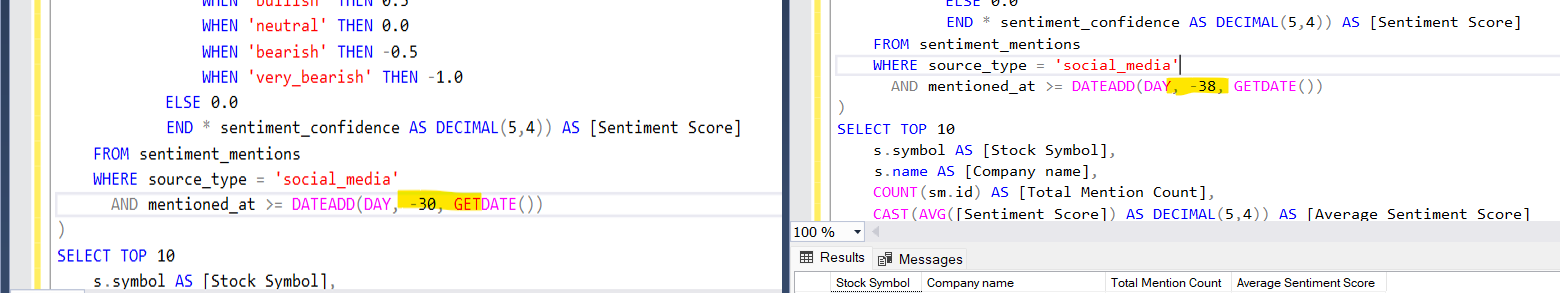
🔟 Top 10 Stocks by Social Media Activity
- Identified the 10 most mentioned stocks on social media in the past 30 days.
- Calculated average sentiment scores using confidence-weighted sentiment categories.
- Tech Used: CTEs, sentiment score mapping, AVG(), COUNT(), JOIN, DATEADD()
- Key Fields: Stock symbol, company name, total mentions, average sentiment.
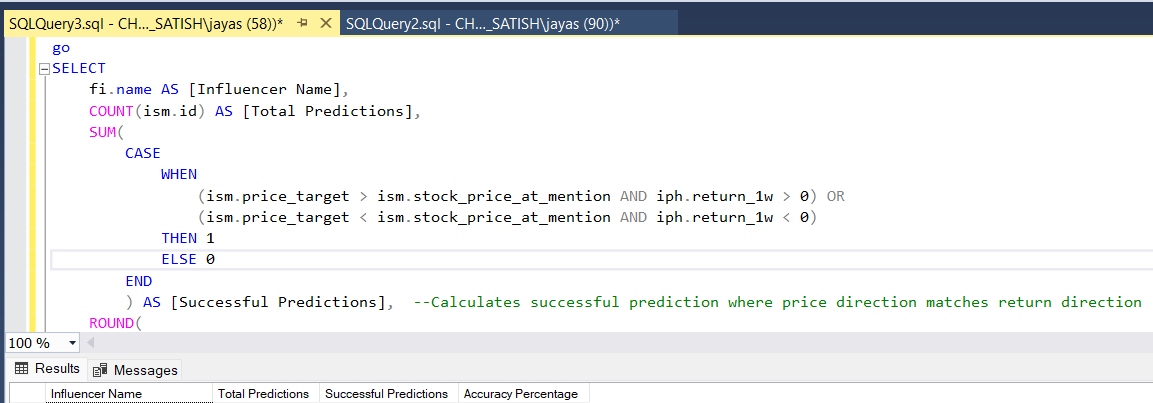
🧠 Influencer Prediction Accuracy
- Measured how accurately influencers predicted stock direction
- Compared price targets with actual 1-week returns.
- Filtered for influencers with at least 10 predictions to ensure meaningful results.
- Tech Used: CASE WHEN, JOIN, HAVING, conditional aggregation
- Key Fields: Influencer name, prediction count, success count, accuracy rate.
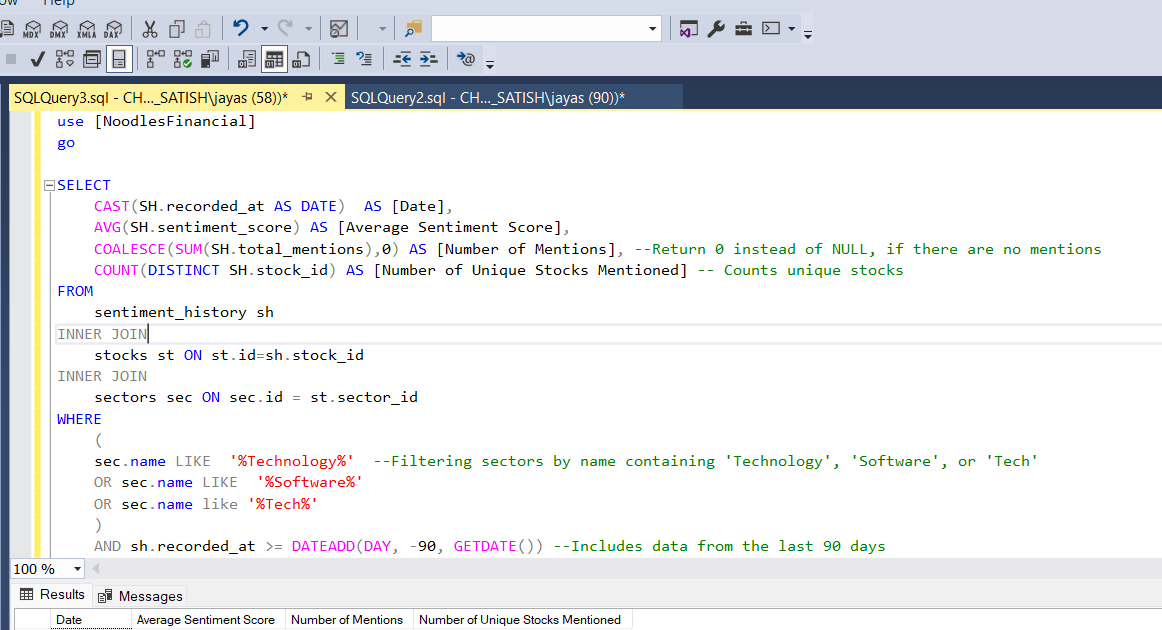
💻 Technology Sector Sentiment Trends
- Analyzed daily sentiment trends for tech-related stocks over the last 90 days.
- Filtered sectors using keywords like 'Technology', 'Software', and 'Tech'.
- Tracked average sentiment, mention volume, and number of unique stocks mentioned.
- Tech Used: String filtering (LIKE), GROUP BY, DATE casting, joins with sector data
- Key Fields: Date, average sentiment score, mentions, unique stocks.
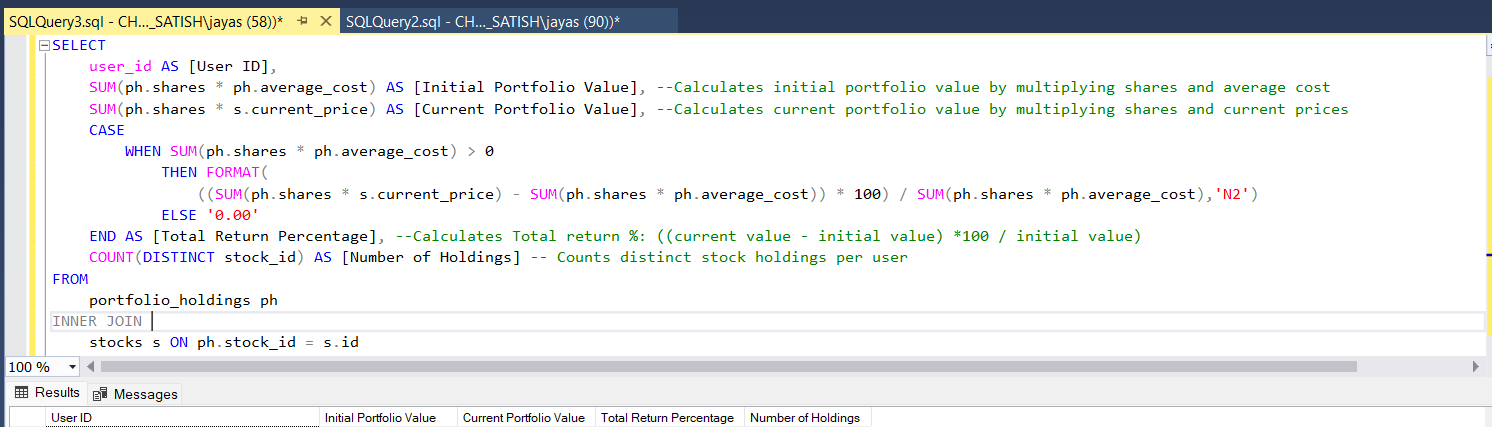
👥 User Portfolio Performance Analysis
- Calculated initial vs. current portfolio value for each user.
- Derived return percentages and counted number of active holdings.
- Included only users with at least one current stock position.
- Tech Used: COALESCE, CASE, aggregation, joins with stock price, HAVING
- Key Fields: User ID, initial and current portfolio value, return %, number of holdings.
📈 Sentiment vs. Price Movement Correlation
- Used window functions to derive next day sentiment score.
- Explored the link between sentiment scores and next-day stock price changes.
- Focused on stocks with at least 30 days of valid data to ensure reliability.
- Tech Used: CTEs, window functions (LEAD()), percentage change logic, filtering by trading days
- Key Fields: Stock symbol, average sentiment score, average next-day price change %, days analyzed.

♻️ Reusable Views
To make reporting easier, I also created reusable views including:
- vw_influencer_prediction_accuracy: Summarizes influencer accuracy based on 1-week stock return direction.
- vw_technology_sector_sentiment_trends: Tracks daily sentiment trends for technology-related stocks.
- vw_user_portfolio_performance_analysis: Calculates portfolio value, return %, and holdings per user.
🛠️ Tools & Skills
- SQL Server, Joins & Aggregation, Window Functions, Conditional Logic, Financial Metrics, Data Validation
See Code here!